The right forecast for every energy process.
From the balancing group and individual RLM offtake points to hybrid power plants, PV and wind portfolios and industrial sites: aimpera forecasts load and generation exactly where reliable forecasts are needed for planning, procurement and operations.
Created automatically, updated continuously and seamlessly integrated into existing energy processes.
Six use cases – one starting point: your process
Balancing group forecasts
Thousands of time series. One reliable balancing group forecast.
RLM (registered load profile metering) and SLP (standard load profile) consumption, iMSys data, PV and wind plants, storage, heat pumps and charging infrastructure: a balancing group increasingly brings together very different consumption and generation patterns. aimpera forecasts the individual components and combines them into a consistent quarter-hourly forecast for day-ahead and intraday.
A balancing group is not a homogeneous load profile. Different customer groups, distributed generation and new flexible consumers change the portfolio continuously. At the same time, weather, calendar, production schedules and short-notice operational changes influence the actual profile.
It becomes particularly laborious with individual information from large RLM customers. Plant holidays, additional shifts, maintenance windows or the shutdown of a production line are often communicated at short notice and in an unstructured way.
- Thousands of heterogeneous load and generation time series have to be combined at quarter-hourly resolution.
- Data quality, missing values, special days and changing consumption behaviour constantly create exceptions.
- Short-notice changes at individual large consumers or generation plants can shift the position of the entire balancing group.
- Customer messages such as "Machine 3 will be down for four days from Monday" have to be interpreted, assigned to a market location (MaLo) and translated into a concrete forecast adjustment.
- The larger the portfolio becomes, the harder it is to scale this process with manual corrections.
aimpera forecasts loads and generators at the level that suits each of them and then aggregates the results into a consistent balancing group forecast.
To do so, aimpera combines historical time series with weather data, calendar information and known operating states. The models are continuously updated with new actual data and reflect different consumption and generation patterns individually.
Short-notice operational information can also feed into the forecast. If an industrial customer reports a four-day machine shutdown, for example, aimpera can assign the information to the relevant load and combine it with historical profiles of comparable operating states. Instead of manually constructing a new load curve, the result is a data-based forecast correction.
The forecasts are updated on a rolling basis and fed back into existing energy data management (EDM) and portfolio management (PFM) systems via interfaces.
- Fewer manual forecast corrections for large-customer messages, plant holidays and special events
- Faster response to short-notice changes in load and generation
- Consistent forecasts from the individual portfolio component to the entire balancing group
- A more reliable basis for decisions in procurement, day-ahead and intraday processes
- Better scalability, even with very large and heterogeneous time series portfolios

Difficult RLM & sub-portfolios
The few load profiles that cause the greatest forecasting effort.
Not every RLM market location follows a stable pattern. Some loads react strongly to production, opening hours, weather or short-notice operational changes. Others change their structure or, as a new market location, have little history.
These exceptions often cause a disproportionate share of the manual rework – and can produce considerable forecast deviations in individual quarter-hours.
Across the whole portfolio, individual difficult load profiles often barely register statistically. Operationally, however, these are exactly the time series that repeatedly need attention.
- A bakery suddenly starts its night-time production two hours earlier.
- An industrial customer adds a shift or cuts production at short notice.
- A cold store reacts strongly to temperature and weather conditions.
- Plant holidays, public holidays or special opening hours change familiar load patterns.
- New market locations do not yet have enough history for a reliable individual forecast.
- Structural breaks and changed operating modes make historical patterns partly unusable.
Simple extrapolations or a single uniform forecasting method quickly reach their limits with such loads. The result: manual corrections, recurring special treatment and avoidable deviations in precisely the quarter-hours where they become economically relevant.
aimpera looks at each load according to its individual characteristics.
Incoming time series are automatically checked for data gaps, outliers and structural changes. For the forecast, historical load patterns are combined with relevant influencing factors such as calendar, public holidays, plant holidays and – where useful – weather data.
Depending on the characteristics of the market location, aimpera can use different forecasting approaches and continuously evaluate which model delivers the best results.
New market locations do not have to start from zero either. If there is not yet enough history of their own, aimpera can draw on similar consumption patterns and comparable loads to generate a reliable initial forecast from the start. With every new measured value, this forecast is then adapted more closely to the actual behaviour of the market location.
If an existing load changes permanently, the new patterns continuously feed into the forecast.
- Less manual special treatment for conspicuous and irregular RLM loads
- Better forecasts where standard methods reach their limits
- Earlier response to structural breaks and changed load behaviour
- Useful initial forecasts for new market locations, even with little history
- More targeted optimization of individual sub-portfolios rather than at portfolio level only
- More reliable forecasts in economically relevant quarter-hours

Hybrid power plants
Multiple assets. One grid connection. One joint forecast.
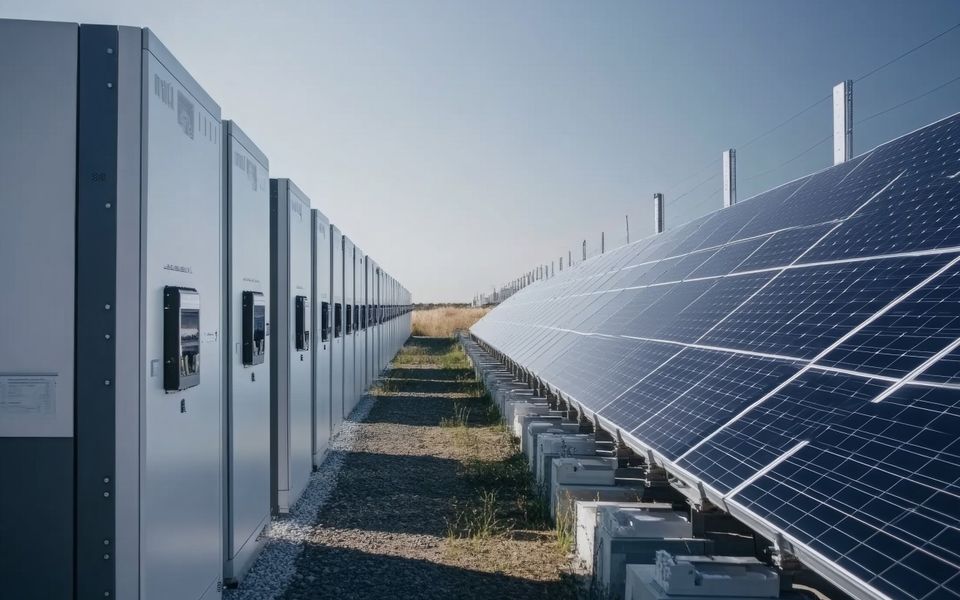
PV, wind and storage are operated together at hybrid sites – so their economic impact arises not in isolation but through their interaction. aimpera forecasts the individual generation sources and combines them into a consistent forecast at the shared grid connection point.
For hybrid power plants it is not enough to forecast PV and wind separately. What matters is what will actually be available and feedable at the shared grid connection point.
Generation profiles overlap, weather conditions change at short notice and the available connection capacity sets a shared technical limit. This is exactly what creates periods in which generation can be fed in completely – and others in which surpluses arise.
- PV and wind follow different weather and generation patterns and must first be forecast technology-specifically.
- Only aggregation shows what total output can be expected at the site.
- The shared grid connection capacity limits how much power can be fed in at the same time.
- Expected surpluses, feed-in limitations and free connection capacity should become visible as early as possible.
- Storage operation, scheduling and marketing need consistent forecasts across all assets.
- Forecast deviations of individual plants affect the position of the entire hybrid site.
aimpera creates individual generation forecasts for the assets of a hybrid power plant and then combines them into a joint forecast at the grid connection point.
The different characteristics of PV, wind and other generation technologies are taken into account separately. The individual forecasts produce a consistent picture of the expected total production of the site.
The forecast generation is then compared with the available connection capacity. This makes it visible early on when generation surpluses may arise, when the grid connection becomes the limiting factor and when additional connection capacity remains available.
These forecasts form the data basis for downstream decisions – such as storage schedules, marketing, schedule creation or optimization of the hybrid power plant.
PV & wind marketing
Precise generation forecasts – for individual plants and entire portfolios.
Whether a single solar park, wind farm or widely distributed generation portfolio: for reliable marketing, it must be known as precisely as possible at all times what output can actually be expected. aimpera forecasts PV and wind generation at plant, park or portfolio level and updates the forecasts continuously for day-ahead, intraday and short-term operation.
The expected generation of PV and wind plants changes continuously. Weather forecasts are updated, plants are temporarily not fully available, curtailment limits feed-in and measurement data can be missing or faulty.
Even for a single plant, such changes can have a considerable impact on the marketing position. With larger portfolios there is the additional challenge of consistently combining many spatially distributed assets with different weather conditions and operating states.
- Weather changes can shift expected PV or wind generation significantly within a few hours.
- Plant outages, reduced availability and curtailment change the feed-in that can actually be expected.
- Missing or faulty measured values make it harder to assess the current generation situation at short notice.
- In portfolios, many individual plants and parks must be consistently aggregated into an overall forecast.
- New plants initially have only limited history of their own and still have to be forecast early on.
- Between day-ahead, intraday and ongoing operation, little time remains for manual checks and adjustments.
aimpera creates generation forecasts at the level where they are needed: for a single plant, a wind or solar park, a sub-portfolio or the entire generation portfolio.
To do so, historical generation data is combined with current and forecast weather information and available operating data. The models take the individual characteristics of each plant into account and are continuously updated with new measured values.
If weather forecasts or operating states change, the expected generation profile is reassessed as well. Plant availability, curtailment and known restrictions can feed into the forecast, so that it reflects not only the theoretical generation potential but, as far as possible, the feed-in that can actually be expected.
For larger portfolios, aimpera aggregates the individual plant and park forecasts into a consistent overall forecast. This keeps it traceable how changes at individual assets affect the expected position of the entire portfolio.
New plants can also be included in the forecasting process with only little history of their own. Available plant information, weather data and comparable generation patterns enable a useful initial forecast, which adapts increasingly to the individual behaviour of the asset as the data base grows.
The forecasts are updated on a rolling basis and made available via interfaces for existing marketing, trading and portfolio management processes.
Industry & multi-site
Think ahead on loads – from a single plant to a portfolio of sites.
Production plans, shift models, weather, maintenance or short-notice operational changes directly influence the electricity demand of a site. aimpera forecasts the expected load on a rolling basis – for individual plants as well as across several sites. This makes load peaks visible earlier and gives energy managers a reliable basis for operations, grid costs and energy procurement.
Industrial load profiles arise from real operations – and these rarely follow a constant pattern. Production lines start up or shut down, shifts change, equipment is maintained, charging infrastructure is added or a site temporarily produces more than planned.
This has a direct economic impact: at metered-demand offtake points, even a single high load peak can raise the relevant annual peak demand. At the same time, central energy procurement needs to know as early as possible what load to expect at the individual sites and across the whole company.
- Production programmes, shift models and equipment states sometimes change the load profile at short notice.
- Without a forecast, load peaks often become visible only once they have already occurred.
- Individual plants have different operating times, load patterns and influencing factors and must be considered individually.
- Weather-dependent consumers, charging infrastructure, self-generation or storage additionally change existing load profiles.
- With several sites, a consistent forecast view for the whole company is often missing.
- For grid fee and demand charge topics, the site-specific load is decisive – for central procurement, the aggregated total load as well.
- Where individual grid fee arrangements are relevant, high-load time windows and other grid-side conditions can also feed into operational decisions.
aimpera forecasts the expected electricity demand at the level where it is needed: for a single site, several plants or the entire site portfolio.
The forecast is based on historical load profiles and takes relevant influencing factors into account, such as calendar, weekdays, public holidays, weather and known operating information. Where such data is available, production and operating information can also feed into the forecast.
The result is not merely an extrapolation of past load profiles but a rolling, updated expectation of the actual future electricity demand.
At site level, aimpera shows early on when critical load situations or new load peaks are emerging. Energy managers thus gain time to review operational measures before the peak actually occurs.
At multi-site level, the individual site forecasts are combined into a consistent overall view. The head office sees both what to expect at each individual plant and how the load of the entire company is developing.
This creates a shared forecast basis for different energy processes – from peak management and grid fee management at the individual site to cross-site energy procurement.
The actual control of consumers, storage or generation plants takes place in energy management. aimpera provides the forward-looking data basis for it: what is likely to happen – before action or control is required?
- Detect impending load peaks earlier instead of reacting only after they occur
- Reliable load forecasts per plant based on individual operating behaviour
- Consistent multi-site view from the individual site to the aggregated company load
- More response time for energy managers and operational teams
- A better basis for demand charge and grid fee topics at each site
- More forward-looking energy procurement through a reliable expectation of future total load
- A shared data basis for forecasting and energy management, without mixing forecasting and control
Forecast transparency with an external service provider
An independent second forecast – based on your own data.
When forecasting, balancing group management or trading are outsourced, a major part of the operational decision basis lies with an external service provider. The result is available – but the causes behind deviations, conspicuous sub-portfolios or individual problematic loads are often only partly traceable.
aimpera creates an additional forecast basis on your own data and thereby makes forecast quality easier to assess.
External service providers often take over a considerable part of the forecasting and balancing group processes. As a result, the municipal utility (Stadtwerk) or energy supplier has less insight of its own into how the forecast is produced.
As long as the results are right, this is usually unproblematic. It becomes more difficult when deviations occur, the portfolio changes or a contract renewal or re-tender is coming up.
- Which customers, loads or generators cause the largest forecast deviations is often not immediately visible.
- Conspicuous sub-portfolios can hide behind good overall portfolio quality.
- It remains unclear whether deviations stem from data quality, modelling, short-notice changes or manual adjustments.
- Different forecast horizons and update times make direct comparison difficult.
- The effect of the provider’s manual interventions is often only partly traceable for the client.
- Before contract renewals, tenders or a change of provider, there is no comparison basis of one’s own.
In parallel to the existing service provider, aimpera can create its own forecasts for selected loads, generators, sub-portfolios or the entire balancing group.
The forecasts are based on your own historical time series and relevant influencing factors such as weather, calendar and available operating information. This creates a second, independent view of the expected load or generation.
This parallel forecast neither has to replace the existing service provider nor change its processes. It can be used specifically where additional transparency is needed – for example for conspicuous RLM customers, individual sub-portfolios or particularly relevant forecast horizons.
If differences arise between the forecasts, they can be examined more closely: is the deviation limited to individual market locations? Does it affect particular periods? Is there a connection with weather, special days or changed load patterns?
For a structured historical comparison, the Forecast Benchmark can also be used. It allows different forecasts to be compared on the same data basis using defined quality metrics.
- An independent second forecast basis on your own data
- More transparency about conspicuous loads and sub-portfolios
- Analyse deviations more precisely instead of looking only at the overall result
- More in-house forecasting expertise, even if operational processes remain outsourced
- A more reliable basis for discussions with the service provider
- A more objective decision basis before contract renewals, tenders or a possible change of provider

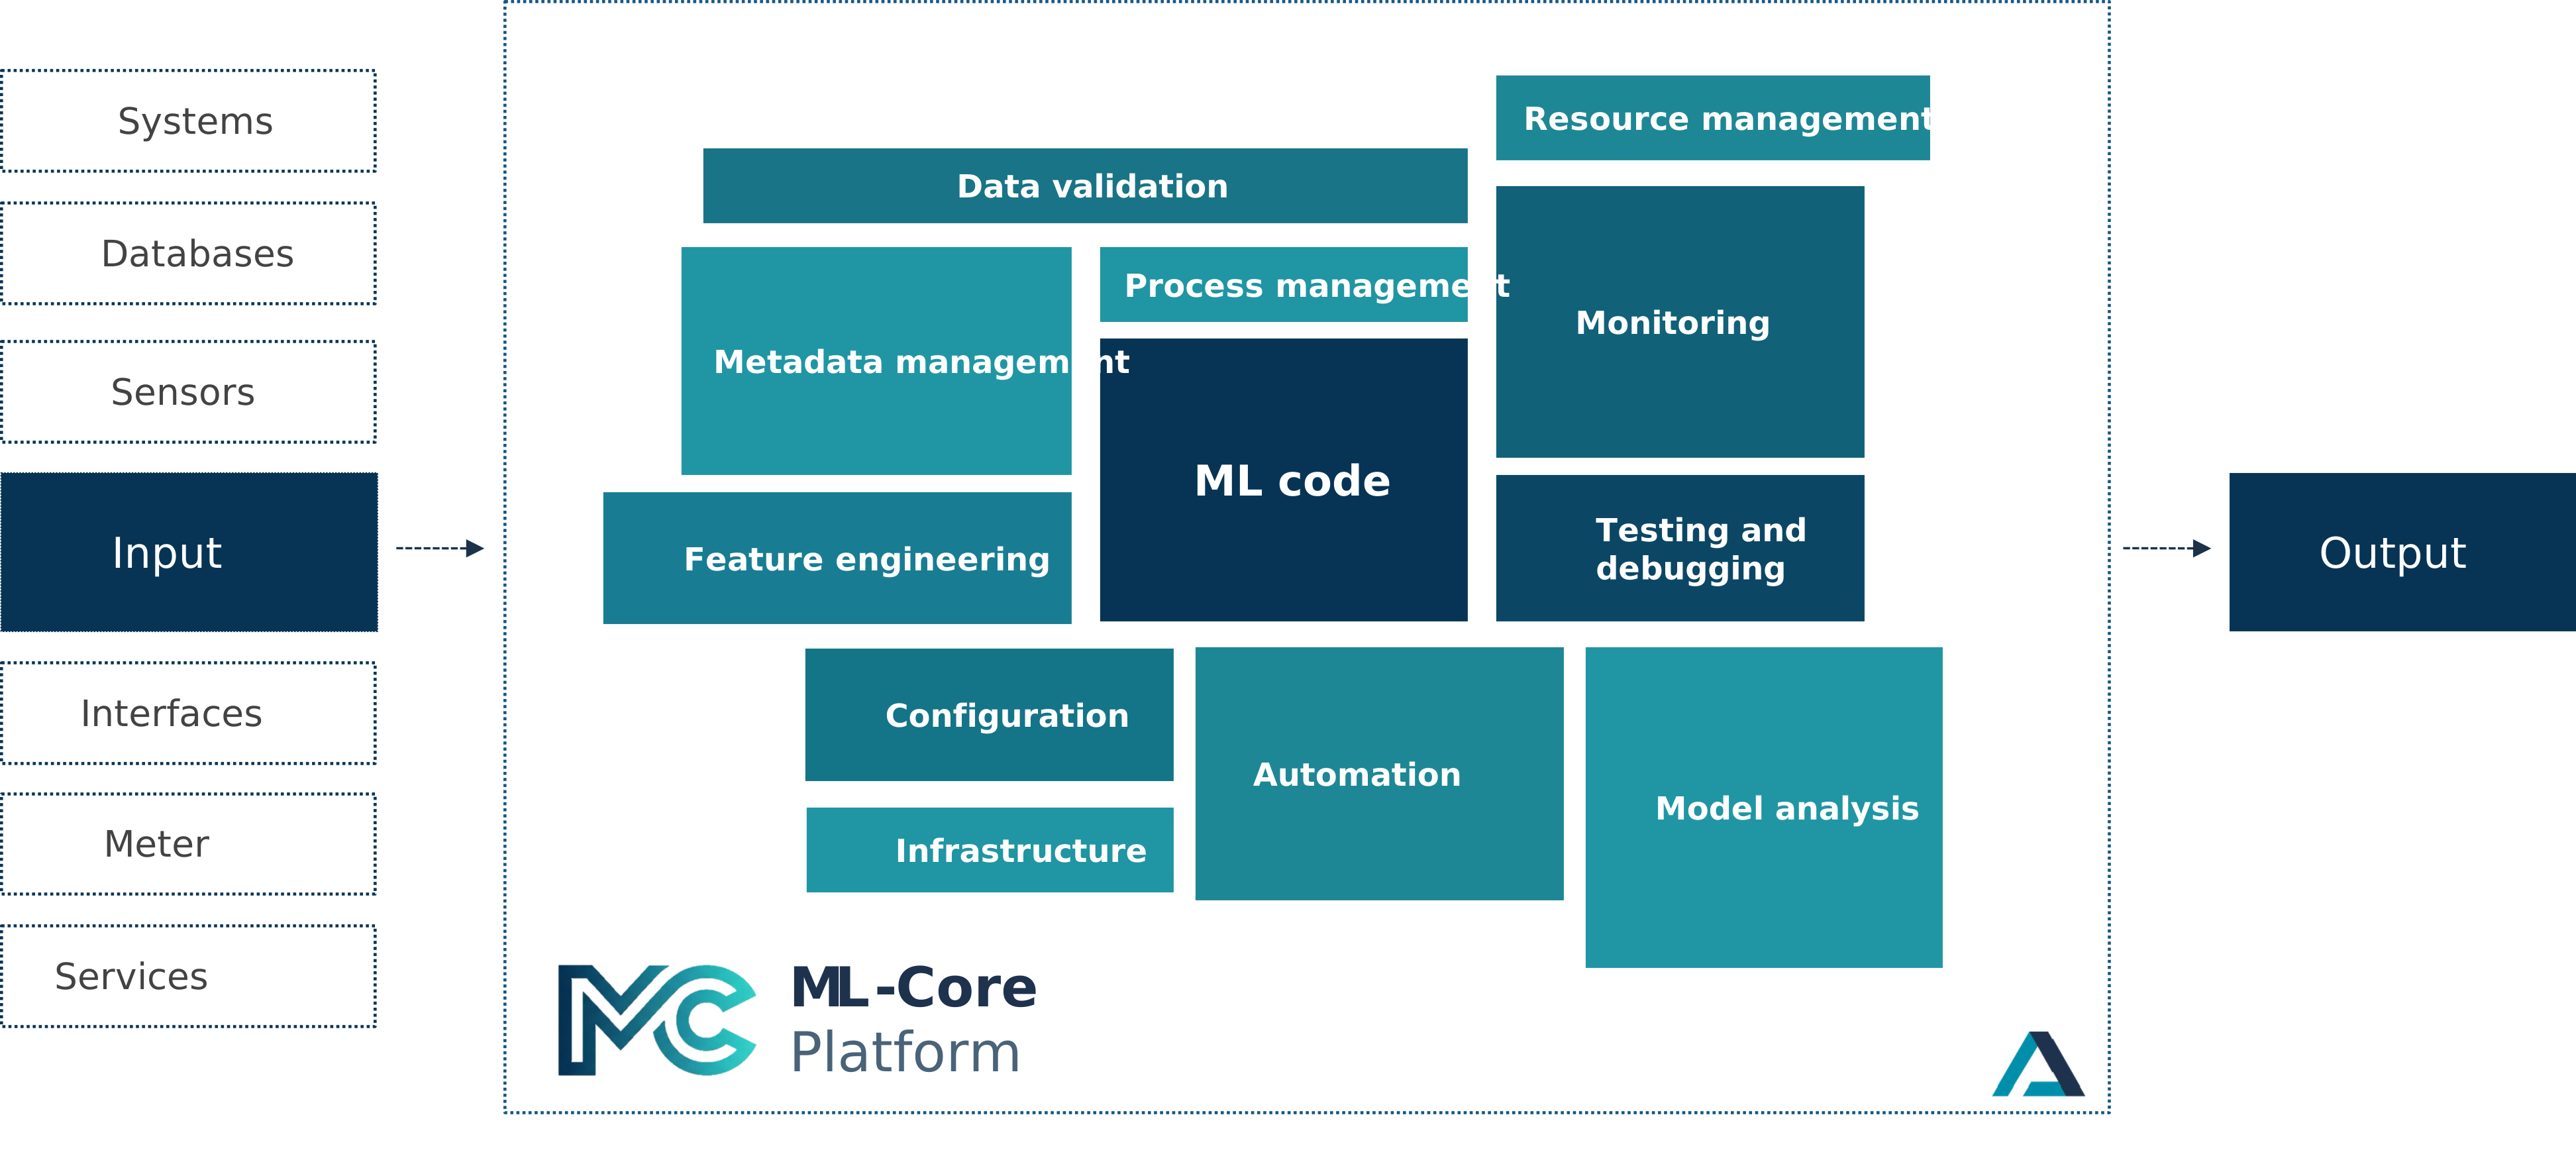
All use cases run on the aimpera ML Core platform
The same ML Core platform, the same time series AI: from data connection and ongoing forecasting to delivery back into your systems. The algorithm is not the focus, but your operational process – from the balancing group to the industrial site.

Where could forecasting do more for you?
Together we look at your data, processes and requirements and show how aimpera Energy Forecasts can be integrated seamlessly into your existing workflows.