Energy forecasts for complex portfolios.
AI-powered load, generation and portfolio forecasts for municipal utilities (Stadtwerke), energy suppliers, direct marketers and portfolio managers – from a single metering point to the full portfolio.
Continuous, rolling forecasts
Always up to date. Always forward-looking.
Forecasts are continuously updated with the latest meter readings – from the intraday horizon up to several days.
What makes continuous forecasts different
- Continuous updating instead of a static day-ahead forecast.
- From the intraday horizon through day-ahead to multi-day periods.
- Adapts automatically to new data situations.
Cross-sector applicable
Electricity, gas, heat – and your individual use case.
The same time-series AI forecasts not only electricity but also gas and heat loads – and can be transferred to other time-dependent variables in your use case.
Cross-carrier and tailored
- Forecasts for electricity, gas and heat on a common foundation.
- Transferable to other time-dependent variables in your operations.
- Custom solutions for specific data sources and use cases.
Quality monitoring
Forecast quality is not a one-off measurement.
Forecasts and actual values are compared continuously, drift is detected and models are retrained in a controlled way.
Quality that stays high
- Evaluation by forecast type, level, horizon and cut-off.
- Monitoring, drift detection and controlled retraining.
- Versioned model and data states.
Single-asset & portfolio forecasts
From the metering point to the portfolio.
The same time-series AI forecasts individual market locations as well as clusters and entire portfolios.
One logic, every level
- Aggregation including netting effects.
- Relevant for procurement, marketing and the balancing group.
- Targeted use on difficult sub-portfolios.
Confidence & uncertainty band
Not just the value – also how certain it is.
Quantiles and confidence intervals represent uncertainty transparently.
A better basis for decisions
- Differentiated assessment by forecast horizon, weather situation and data quality.
- A better basis for dispatch and trading decisions.
- Separate view for metering point, cluster and portfolio.
Seamless integration (API-first)
Your system landscape stays. The forecast is added.
aimpera delivers forecasts, aggregates and quality information as an additive layer alongside your existing systems – without a system change.
Connection without rip-and-replace
- Connection via REST API, SFTP and file exchange.
- Integration into EDM, PFM, BRP, VPP and trading systems.
- Additive forecasting layer instead of a system change.
Load change notifications
An email becomes a better forecast.
Load changes often reach you informally by email. aimpera captures these notifications automatically, evaluates them with AI and feeds them directly into the running forecast.
From notification to forecast
- Incoming email notifications are captured and structured automatically.
- AI-based evaluation of connections/disconnections, special dates and planned interventions.
- The detected changes flow immediately into the rolling forecast.
aimpera v3 forecast model
RLM and load forecasts
For individual market locations, customer groups, clusters and portfolios – the basis for procurement, trading and the balancing group.
- RLM and electricity consumption
- customer-specific load profiles
- difficult, volatile consumers
- special forecasts for operational particularities
PV and generation forecasts
For plants, parks and aggregated generation portfolios – PV and wind from asset to portfolio level, based on the aimpera v3 forecast model.
- PV and wind
- asset, park and portfolio level
- further generation types on a project basis
Portfolio and aggregate forecasts
From individual time series to the aggregation relevant for procurement and marketing.
- MaLo → cluster → portfolio
- netting effects taken into account
- relevant for procurement and marketing
Balancing-group-related forecasts
Forecasts and aggregations for balancing-group-related processes and existing portfolio/BRP workflows.
- balancing-group-related processes
- connection to BRP workflows
- aggregated schedules
Forecast quality is decided in the real world.
in the real world
How aimpera Forecast works
From your systems and data sources through quality assurance and forecasting back into your process – one continuous, monitored workflow.
Connect data
Meter, master, weather and calendar data, customer notifications and relevant operational information.
Ensure data quality
Handling of missing values, outliers, special days, structural breaks and operational particularities.
Generate forecasts
Apply suitable models per time series, cluster or portfolio.
Continuous monitoring
Forecast quality is not measured once but continuously measured and monitored – against relevant benchmark forecasts, with drift detection and alerting, so that quality stays high over time.
Aggregate
MaLo → cluster → portfolio → process context, incl. netting effects.
Back into the process
Deliver forecasts, aggregates and quality information into the existing system landscape.
Good forecasts never stop learning
aimpera combines forecasting, uncertainty, real-time correction and continuous model improvement in one end-to-end process.
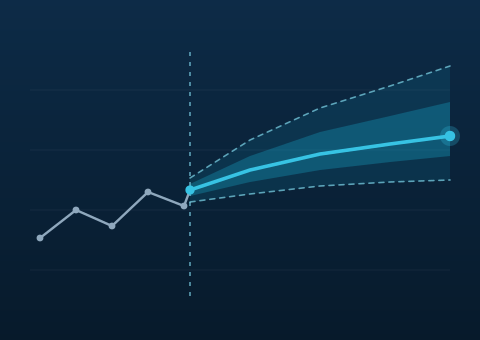
Forecast & uncertainty
- Point forecasts for operational use
- Quantiles and confidence intervals to represent uncertainty transparently
- Differentiated assessment by forecast horizon, weather situation and data quality
- separate quality view for metering point, cluster and portfolio
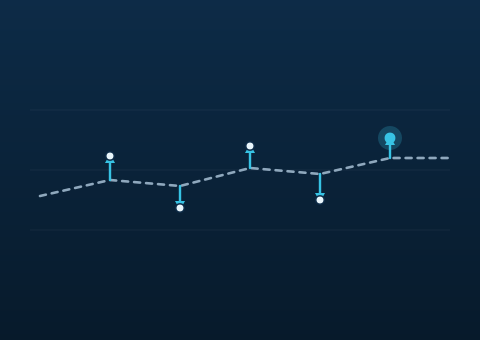
Real-time correction
- continuous correction with current meter readings, where provided
- Consideration of availabilities and outages
- Curtailment and manual interventions in generation
- transparent flagging of missing or implausible input data
- Fallback mechanisms for data or model failures
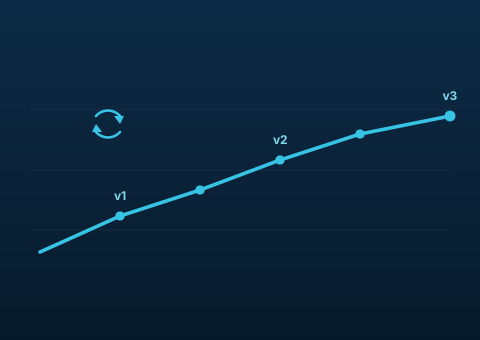
Continuous improvement
- continuous comparison of forecasts and actual values
- Evaluation by forecast type, level, horizon and cut-off
- Monitoring and drift detection
- controlled retraining and versioned model states

One of the biggest misconceptions in forecasting is that a model is ever finished. To me, a good forecast is not one that hits the mark particularly well once, but one you can rely on every day. And because the environment keeps changing, the model also has to keep comparing, learning and improving.
Implemented in the aimpera ML-Core platform
The aimpera ML-Core platform is designed for time-series AI systems on energy data – with end-to-end automation from training through monitoring to error detection and retraining, so that the models continuously adapt to new data and changing conditions.
The four time dimensions of a forecast
Good forecasts do not come from good models alone. What matters is that horizon, resolution, update frequency and available information fit the use case exactly.
Specific horizon and resolution values are defined consistently for each forecast type.
Your system landscape stays. The forecast gets better.
aimpera is integrated as a forecasting layer into existing energy-industry processes. The technical integration path depends on your existing architecture.
- required input and master data, data validation and mapping
- forecast values, aggregates, uncertainty and quality information as outputs
- update and delivery times, monitoring, status messages and fallback
- without having to replace your EDM, PFM, BRP, VPP or trading system
Deploy where forecasts create economic value
Energy forecasts in detail
Do we have to replace our existing forecasting system?
No. aimpera can be used as a standalone forecasting solution that replaces existing forecasts, or it can be integrated into your existing system landscape as an additional forecasting layer. EDM, PFM, BRP, VPP or trading systems can remain the leading systems, unchanged.
What data does aimpera need?
Historical actual values are usually sufficient to get started. For a direct benchmark, it also helps to have your existing forecast including its creation time. Depending on the use case, further information such as master data, weather data, calendar information or customer notifications can be included. Which data is actually required depends on the respective forecasting goal.
Can aimpera receive meter data directly from the customer or from the customer's infrastructure?
Yes. aimpera can receive meter data directly from the customer or from the customer's infrastructure – independently of the metering point operator and in addition to the regular meter data from market communication. This includes online power values from industrial measurement or control technology, for example from SCADA, values forwarded via the customer's energy data management (EDM) system, and values from an additional measurement controller on site. This enables meter value updates during the day that flow directly into the running forecasts. Transmission takes place via the REST API (HTTP POST with JSON) or as a CSV file; further connections such as OPC, ODBC/SQL or PGIM can be added on a project basis.
Can aimpera initially run in parallel?
Yes. aimpera can initially be operated completely in parallel to your existing forecast. This allows forecast quality to be compared directly under real conditions without having to change existing processes or systems. Based on the results, you then decide whether and to what extent aimpera goes into production use.
How are forecasts transmitted?
Forecasts can be transmitted flexibly via REST API, SFTP, standardized file exchange or customer-specific interfaces. The technical integration path depends on your existing architecture and processes.
Which forecast types are supported?
aimpera supports, among others, RLM and load forecasts, PV and generation forecasts, portfolio and aggregate forecasts, and balancing-group-related forecasts. A particular focus is on PV and demanding load profiles. Further generation types and individual forecasting tasks can be covered on a project basis.
Can we start with selected sub-portfolios first?
Yes. For large portfolios in particular, a targeted start often makes sense. aimpera can first be applied to individual customers, plants, clusters or time series. This allows the benefit to be evaluated in a clearly defined area. A later extension to further sub-portfolios or the entire portfolio is possible at any time.
How is forecast quality measured?
Forecast quality is assessed using clear metrics that show how close a forecast is to the values that actually occurred. Which metrics make sense depends heavily on the use case – so aimpera first discusses exactly how the forecast will be used later and which errors are particularly relevant. Based on that, the appropriate evaluation methodology is chosen, for example for average deviations, systematic over- or underestimation, or particularly large forecast errors. Testing is done on periods the model has not seen before, and the results are compared with suitable reference models and, on request, directly with your existing forecast.
What is the difference between resolution and update frequency?
Time resolution describes the grid of the forecast values, for example 15-minute intervals. Update frequency, by contrast, determines how often a new forecast is calculated and provided. A forecast can, for example, be available on a 15-minute grid and still only be updated once an hour. Both parameters can be adapted independently of each other to the respective use case.
How are new customers or plants without a long history handled?
Reliable forecasts can also be created for new customers or plants with a short history. For this, aimpera uses models that can take into account information from available features, comparison profiles and similar time series. As soon as further actual data is available, it is used to increasingly align the forecast with the individual consumption or generation behavior.
Can I check the forecastability of new customers in energy trading and sales before signing a contract?
Yes. For new customers and quote requests in energy trading and sales, aimpera can assess in advance how well their load profile can be forecast – before a contract is concluded or a price is calculated. The basis is the prospect's available load profile or consumption data; where the history is short, comparison profiles and similar time series are used in addition. The result shows the forecast quality and typical deviations to expect, and which influences, such as weather, operating processes or seasonality, determine forecastability. This allows the forecast and procurement risk of a new customer to be factored into the quote calculation, rather than only being noticed after supply starts through balancing energy costs. Which data basis is sufficient depends on the individual case.
How does aimpera handle changed portfolio assignments?
Changes to customer, MaLo, cluster or portfolio assignments can be taken into account in the forecasting and aggregation logic. As a result, forecasts remain consistent across the different aggregation levels even when portfolio composition changes.
Can forecasts and quality metrics be delivered together?
Yes. In addition to the forecasts themselves, aggregates, quality metrics and – depending on the use case – uncertainty information can be provided. This information can be transmitted to your systems together, making it possible not only to use forecasts but also to continuously assess their quality and reliability.
How can artificial intelligence improve balancing group forecasts for municipal utilities and energy suppliers?
AI-based balancing group forecasts can represent different consumption and generation patterns more precisely and take changes into account at an early stage. To do this, historical load profiles, weather data, calendar information and – where available – current measurements and operational information are combined.
aimpera Energy Forecasts creates forecasts for individual market locations, customer groups and sub-portfolios and aggregates them into consistent balancing group forecasts. Rolling updates help to respond to new data and short-term changes.
This allows municipal utilities (Stadtwerke) and energy suppliers to improve their forecasting processes and potentially reduce forecast-related balancing energy costs. Whether and to what extent an improvement is achieved can be examined in the Forecast Benchmark using real data.
For which RLM load profiles do AI-based load forecasts make the most sense?
AI-based RLM (registered load profile metering) load forecasts are particularly interesting for complex or highly fluctuating consumption profiles that are difficult to represent with classical forecasting methods.
Typical examples are industrial companies with changing shift schedules, production stoppages, plant shutdowns, irregular load peaks or short-term changes in consumption behavior.
aimpera takes historical time series and relevant influencing factors into account in order to reflect such particularities in the forecasts. The models can be used for individual customers, selected sub-portfolios or larger energy portfolios.
Whether AI actually delivers better results for a specific load profile should be verified using historical actual data and a fair comparison with existing forecasts.
Do your forecasts have room for improvement?
Let's find out – with a methodologically fair forecast comparison on your own data.